Canadian officials have warned that the country is on track to see its worst wildfire season ever. As if that’s not enough, the effects of the fires are being felt far beyond where they are taking place. Their smoke is causing air pollution levels in the northeastern United States to rise to dangerously high levels.
Canada is having an historic wildfire season
Canada has already had to endure more than 2,200 wildfires this year. As of June 6, 424 fires were still actively raging across Canada, with a large portion of them concentrated in Quebec. The province, which has already experienced twice its average number of wildfires for this time of year, had 150 fires that were actively burning fires as of this week.

Canada's fires are impacting U.S. air quality
The smoke from those fires has been working its way south to wreak havoc on air quality in the U.S. To give you an idea of just how severe it has been, at one point on June 6, New York City had the worst air quality of any major metropolitan area – worse than cities like New Delhi, Baghdad, and Qatar.
As a result, New York City public schools had to cancel outdoor activities.
But the impact has been far wider than just New York City. The impacts on air quality have been felt as far south as South Carolina and as far west as Minnesota, with the most severe impacts generally concentrated around New England and the Mid-Atlantic region.
Why wildfire smoke is such a concern
Wildfire smoke contains tiny particulate matter that is only 2.5 microns in size (PM2.5). On June 6, the concentration of PM2.5 in New York City was about 10 times the recommended limit.
The problem with these tiny pollutants is that they can travel deep into the lungs and enter the bloodstream. PM2.5 has been linked to a number of health problems, including heart disease, asthma, and other respiratory illnesses. According to the World Health Organization, outdoor air pollution accounted for about 4.2 million premature deaths in 2019.
The danger presented by wildfire pollutants varies with the vulnerability of those who are exposed to them and their concentration in the air. Those who are more vulnerable or exposed to higher concentrations of pollutants face higher danger.
The Environmental Protection Agency (EPA) indexes pollution on a scale 0 to 301+. It’s called the Air Quality Index (AQI), and higher AQI values represent greater danger.
|
AQI Value
|
Rating
|
Explanation
|
|
0-50
|
Good
|
Air quality is satisfactory, and air pollution poses little or no risk
|
|
51-100
|
Moderate
|
Air quality is acceptable. However, there may be a risk for some people, particularly those who are unusually sensitive to air pollution.
|
|
101-150
|
Unhealthy for sensitive groups
|
Members of sensitive groups may experience health effects. The general public is less likely to affected.
|
|
151-200
|
Unhealthy
|
Some members of the general public may experience health effects; members of sensitive groups may experience more serious health effects.
|
|
201-300
|
Very unhealthy
|
Health alert: The risk of health effects is increased for everyone.
|
|
301+
|
Hazardous
|
Health warning of emergency conditions; everyone is more likely to be affected.
|
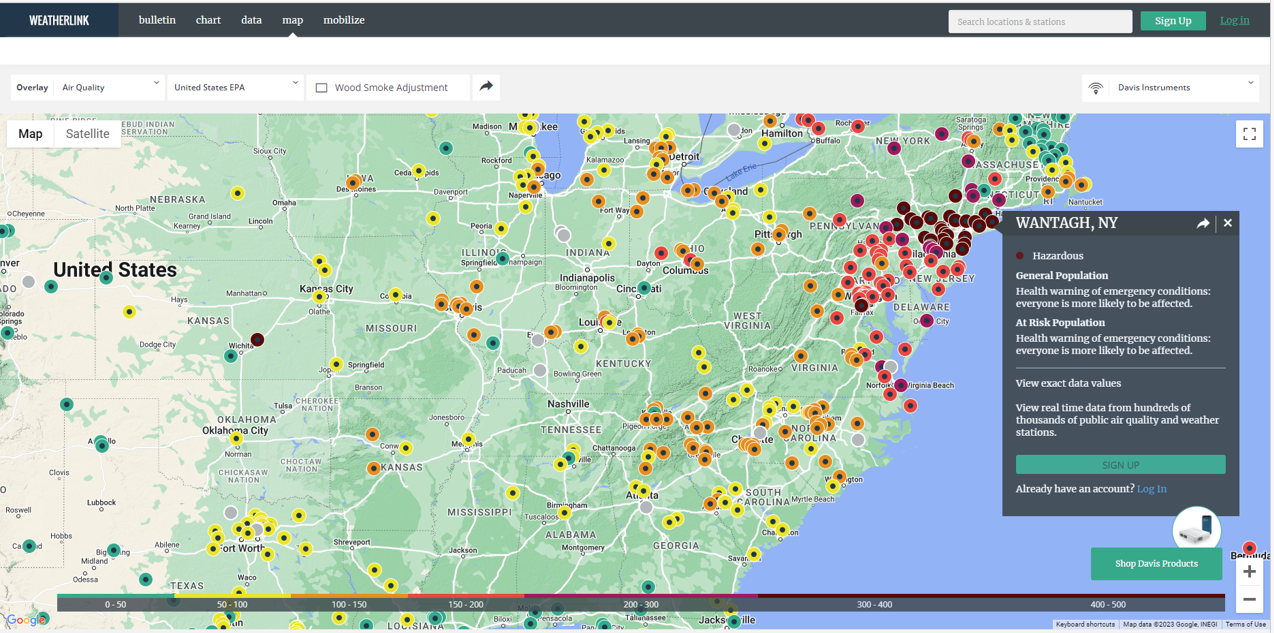
Even as this blog post is being written, we can observe Hazardous levels of pollution extending from areas in central New York down to Washington, DC. And New York City’s current AQI is at 353, once again making it the city with the worst air quality in the world.
How to protect yourself against pollution
The California Air Resources Board (CARB) recommends that you monitor local air quality, and when it is poor, take the following precautions:
- Stay indoors.
- Avoid breathing smoke.
- Use N95 masks.
- Install a high-efficiency air filter with a MERV 13 rating or higher.
- Use a CARB-certified air cleaner.
An excellent resource for real-time updates on air quality is AEM’s WeatherLink Air Quality Map, which is maintained under our Davis Instruments brand. Every dot on the map represents an AirLink Air Quality Monitor that is sending live data to the WeatherLink Cloud. Each data point is provided by a weather enthusiast who has chosen to share their data publicly with our global network. Best of all, we make this information freely accessible as a public service.