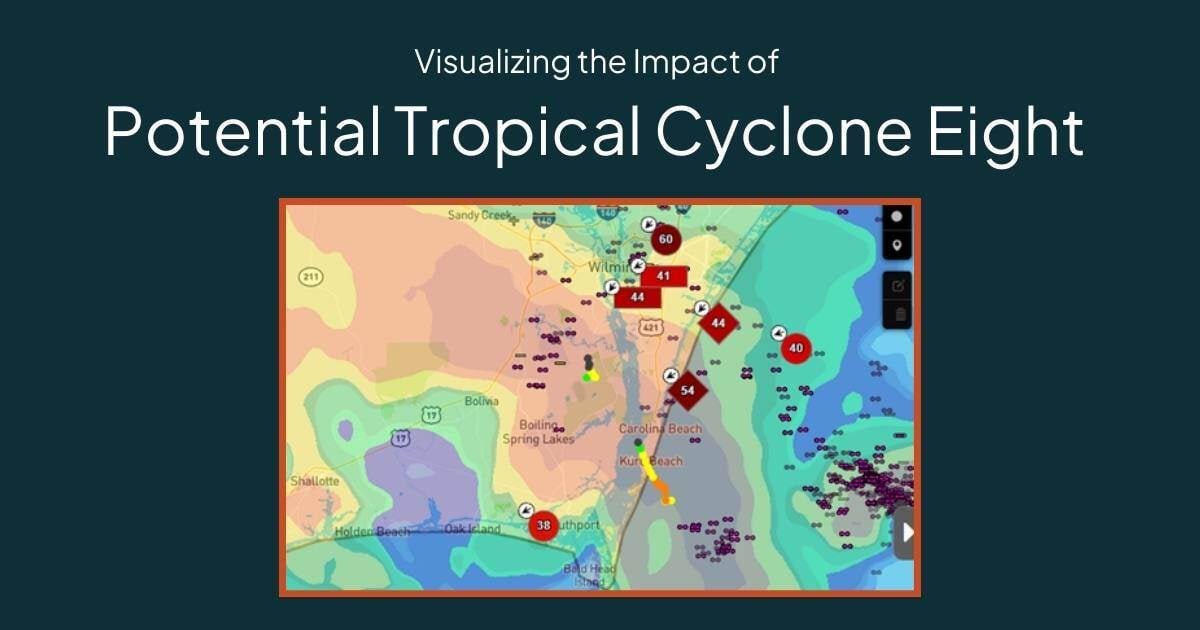
The team at AEM's Davis Instruments brand recently published a breakdown of Potential Tropical Cyclone Eight, the unnamed storm that bombarded coastal southeast North Carolina with twenty-plus inches of rain on Monday, September 16, 2024. Their article visualizes the storm and its impact through weather maps and data as well as by sharing photos and video directly from the flood zone.
Here's a preview of that piece, which you can read in its entirety on the Davis Instruments site.
Last week’s historic rainfall and flooding in coastal North Carolina provided a reality check that severe weather is becoming increasingly normalized in our communities. The system, identified as Potential Tropical Cyclone Eight back on September 15, didn’t get the national media attention of a named storm, but it still brought major damage, disruption, and downpour, including a deluge of 12 to 20 inches (300 to 510mm) over 12 hours for a 25-mile-wide (40km-wide) area between Carolina Beach and Columbus City.
Southeast North Carolina is an example of an area where changes in weather patterns and floodplains are causing an increased risk for destructive floods. This September’s storm – classified as a once-in-a-thousand-years flood – was the fifth “once-in-a-lifetime” flood to affect the region over the last 25 years.
Here’s a snapshot from our sister brand Earth Networks’ Sferic Maps® lightning detection and storm tracking app that was captured just before noon on Monday, September 16, 2024, as the system pummeled the coastline near Carolina Beach.
The area in red represents the most intense area of the storm, which ultimately cut a damaging path several hundred miles inland in what some have called a “fire hose” effect. The purple arrows represent lightning strikes. The numbers inside the red shapes are real-time wind speeds (expressed in miles per hour), with a vector arrow showing their direction.
...Continue here to get the rest of the story, including:
- More weather maps and meteorological context
- Photos and video from local citizens and media illustrating the impact
- Details on how the storm disrupted transportation throughout the region
