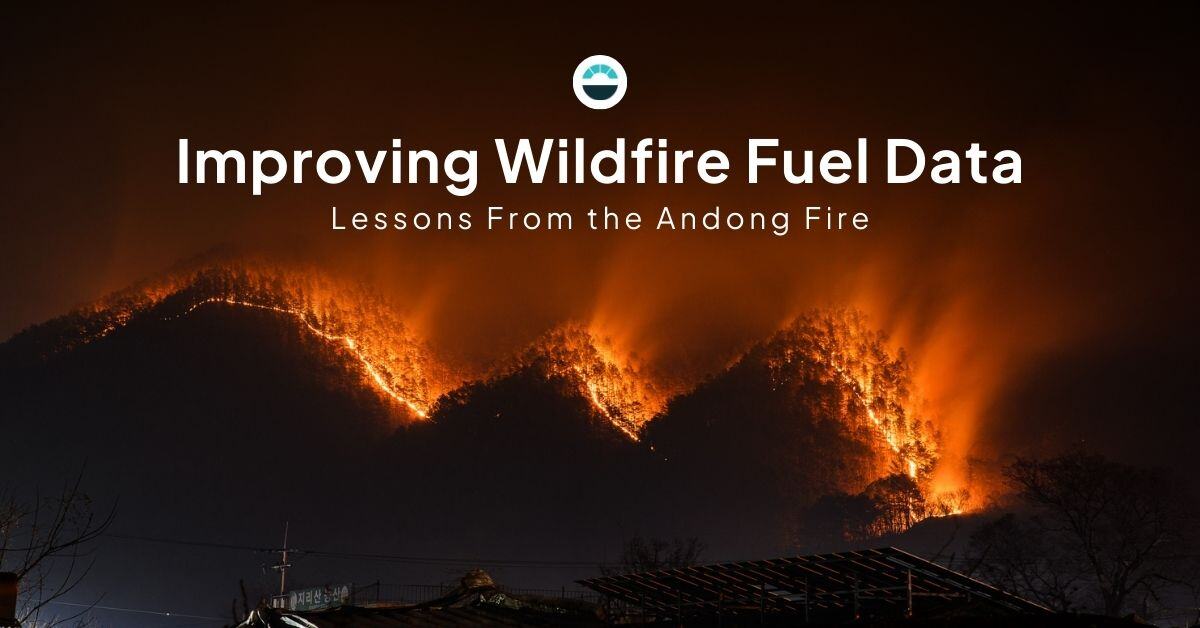
Wildfires are becoming more frequent, more severe, and increasingly destructive. In response, fire agencies and governments around the world have poured resources into suppression capabilities—more aircraft, more crews, faster response times. But suppression alone isn’t enough. Relying solely on response is like investing only in ambulances for public health, while ignoring prevention and diagnosis.
Meanwhile, fire behavior modeling tools have advanced dramatically. Scientists today have robust formulas and simulation engines capable of accurately predicting fire spread, intensity, and risk under most conditions—if they are given the right inputs.
And that’s where the system breaks down.
In this blog, I will walk you through:
- The fuel data gap: How outdated, generic fuel data limits fire modeling accuracy
- AEM's vision: A dynamic, scalable approach to structural and drought-aware fuel data
- Proof in the fire: What the 2025 Andong Fire shows about the power of better inputs
The fuel data gap
At the heart of every fire behavior model lies fuel data: the structure, type, and condition of the vegetation (and built environments) that fires burn through. But most fuel data sources today are:
- Static, representing only average conditions over long periods (12+ months)
- Outdated, with update cycles ranging from annual to multi-year
- Coarse, in that they have too few fuel types which do not sufficiently represent the real-world structural and drought versions of each base fuel type
This mismatch creates a paradox: we have excellent predictive tools, but they’re fed with poor-quality inputs—resulting in unreliable outputs, especially under extreme or rapidly changing conditions.
AEM's vision: Closing the gap
AEM’s Wildfire Data as a Service (DaaS) was built to bridge the gap between advanced fire behavior modeling and the outdated fuel data that holds it back. The vision was clear: fuel data should be as timely, scalable, and actionable as the weather data fire behavior analysts already trust.
To make that possible, AEM developed a global fuel data pipeline from the ground up—fusing satellite and remote sensing data, vegetation type data, AI landform products, and geospatial processing into a seamless, near-real-time fuel data product.
We have also leveraged the latest science to redefine how fuels are classified. Traditional systems lump vast areas into generic types like “forest” or “grassland,” overlooking the structural factors that shape fire behavior. AEM adds critical layers of detail—capturing fuel height and cover, and drought state—that directly impact how fast and how fiercely fires spread.
And unlike current systems that are slow, or manual to update or limited by jurisdiction, we developed a process that is fast, global, consistent, and fully controlled in-house. That means updates every 10 days, anywhere in the world.
Proof in the fire: Testing AEM Fuels Data during the 2025 Andong fire
In March 2025, multiple wildfires broke out near Andong in South Korea and burnt through to the East Coast. The fires burnt about 130,000 hectares of mixed evergreen and deciduous forest. This event provided a real-world opportunity to compare how well our global fuel datasets explain fire severity—before and after the burn.
Using imagery to compare fuel data quality
To evaluate the predictive value of fuel data, AEM compared two fuel datasets. The first has fuel types based on simple landform, and the second is AEMs global fuels with structural variants against actual fire severity. Fire severity was estimated using the differenced Normalized Burn Ratio (dNBR) derived via ESA Sentinel-2 data. dNBR is a widely accepted remote sensing metric that shows the amount of change in vegetation cover likely caused by fire severity. High dNBR values (seen as deeper purples in imagery) correspond to areas of more severe fire impact.
The analysis compared two approaches: 1) Simple - fine landform type fuel classification; and 2) AEM's structural and drought aware fuels.
FINE LANDFORM TYPES
The first comparison used traditional “representative” fuels based on fine landform classification—basic categories like “evergreen needleleaf forest” or “grassland.” These fuel types, while common in most national datasets, are generalized and static (Figure 1). When overlaid with dNBR imagery, they showed some correlation with the areas of higher fire severity—but also left many severe burn zones unexplained (Figure 2).


AEM'S STRUCTURAL AND DROUGHT-AWARE FUELS
Next, AEM's high-resolution global fuels dataset was compared (Figures 3 and 4). Unlike the simpler approach, this method accounts for fuel structure (height and cover) and drought affected variants—two factors known to influence fire behavior dramatically.
The difference was clear: AEM’s fuels explained more of the severe burn patterns, with higher visual alignment between fuel types and actual post-fire severity shown in the dNBR imagery.


Zoomed-in comparisons (Figures 5 and 6) further reinforced this. In areas where the basic fuel categories missed or misclassified severity zones, AEM’s fuel classifications explained much more of the areas where the fire did and did not burn more intensely.
This kind of overlay analysis makes a strong case: better fuel data inputs result in fire modelling outcomes that are likely to be more predictive of real-world fire severity and therefore general fire behavior.


Conclusion: Better inputs, better predictions
The post-fire analysis of the 2025 Andong Fire in South Korea offers solid evidence: dynamic, high-resolution fuel data with structural and drought variants supports better fire behavior prediction outcomes than simpler fuel classification approaches. AEM’s structural and drought-aware classifications showed stronger alignment with actual burn severity than traditional landform-based methods—proving that more nuanced fuel inputs, reflective of current state conditions can lead to more accurate modeling of fire spread, intensity, and risk.
AEM’s Wildfire DaaS handles the complexity of modern fuel modeling—so you don’t have to. With 20-meter resolution fuel map files delivered to your secure FTP site every 10 days, and corresponding web map services (WMS) of these layers, AEM is bringing next-generation wildfire fuel data to the world.
