A house is only as strong as its foundation, and a scientific report is only as strong as the science on which it is grounded. Here's an inside look at the science behind AEM's U.S. Lightning Report.
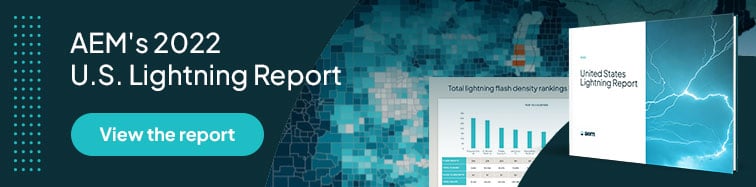
Each year, we publish AEM's U.S. Lightning Report to provide data about differences and similarities in lightning behavior across geographic regions and over time. This trend information, when combined with real-time detection and alerting, can arm communities and organizations with the insights they need to better protect people and infrastructure against lightning risks.
Given the practical importance of this data, I thought it would be helpful to discuss some of the science behind it. You'll walk away with a much better understanding of why we look at lightning the way we do.
What do we count when we count lightning?
Unless you're already familiar with lightning science, you probably think the process goes something like this: (1) There's a bolt of lightning. (2) You count it. (3) Maybe you record some other details about when and where it occurred. (4) Then you're done.
Unfortunately, it's not that simple. Before we can even start counting, we must decide what to count.
There is no one thing in science that corresponds exactly to what we ordinarily think of as lightning. There are lightning pulses, which are surges of electric current that are usually accompanied by a burst of light. Then, there are lightning flashes — collections of pulses close in space and time.
When we compare lighting activity across geographic regions, AEM focuses specifically on lightning flashes. We do this for three main reasons:
- Lightning flashes tend to be more important than mere pulses to the people and organizations that rely on lightning data to keep students, workers, and communities safe.
- Flashes, which are made up of a series of pulses that approximate the continuous ionized channels of complete lightning bolts, tend to more closely resemble what comes to mind when most non-scientists think of lightning.
- The percentage of lightning flashes detected by our Earth Networks Total Lightning Network® (ENTLN) remains largely the same throughout the United States (over 95%), even across regions with differing sensor densities.
Lightning quantity vs. lightning qualities
Lightning pulses still have a role to play in our understanding of lightning — although, perhaps, a different role than you might have thought.
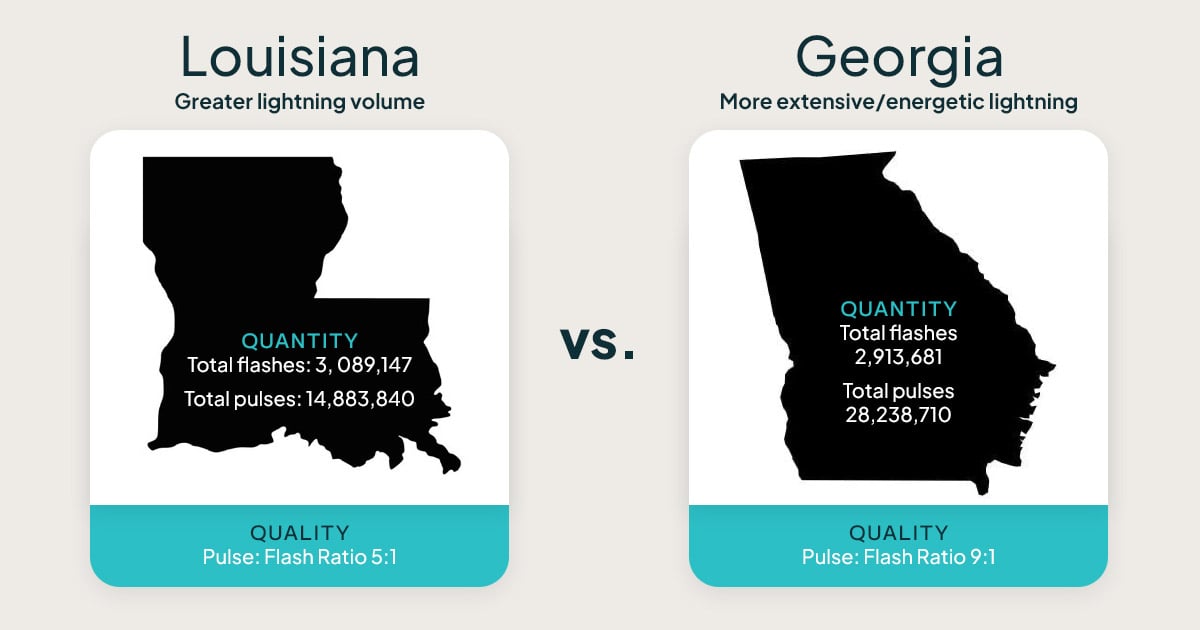
Some lightning flashes are more extensive and energetic than others. We can gain some insight into exactly how extensive and/or energetic they are by looking at the number of pulses that comprise those flashes.
To boil it down to the most simplistic terms (and at the risk of some oversimplification), we can think of lightning flashes as an indicator of the quantity of lightning activity in an area, while lightning pulses tell us something about the qualities of that activity. A small sample of data from our 2022 U.S. Lightning Report illustrates this point perfectly:
Lightning volume vs. lightning density
Even when we narrow our focus to the quantity of lightning activity, there are still more distinctions we need to draw.
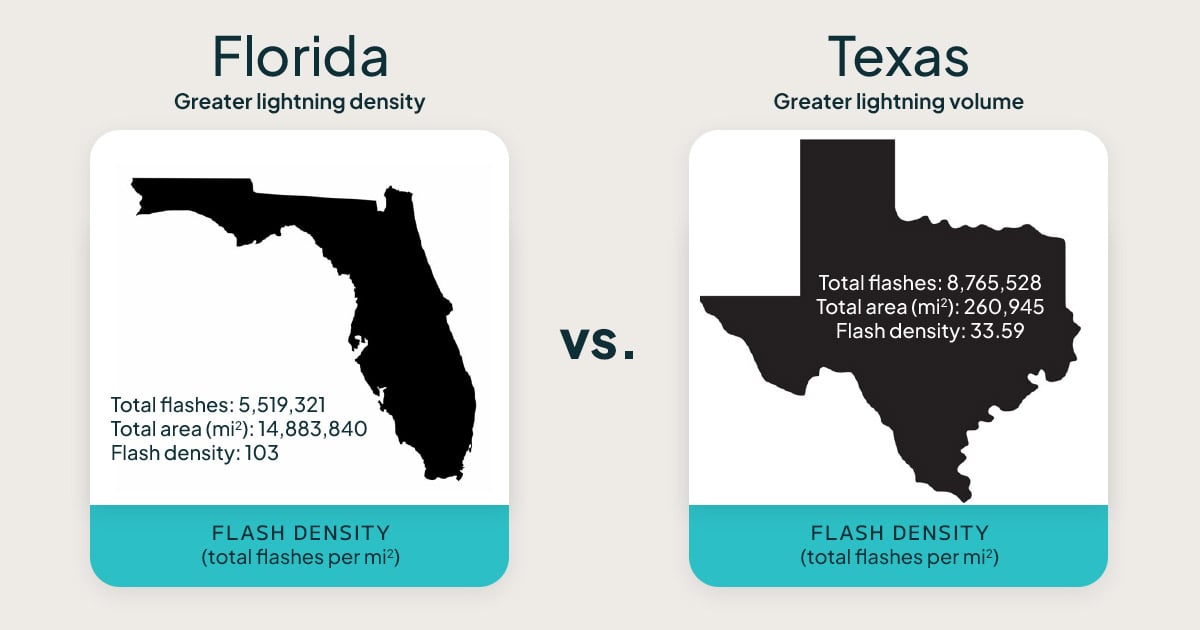
When we count the number of lightning flashes in a given area (say, a state or a county), we come up with a measure of the volume of lightning in that area. But what if we want to compare two areas of different sizes (for example, Texas vs. Florida)?
Raw volume comparisons will generally skew in favor of the larger area. For example, although Texas had a little over 1.5 times as much lightning activity as Florida in 2022, it is almost five times the size of Florida. So, yes, based on raw volume, Texas gets more lightning than Florida. But if you stood at any given location in Texas, your probability of seeing lightning would be lower than someone who randomly picked a spot in Florida.
To eliminate this skewing, AEM's lightning report also looks at lightning flash density or the number of flashes per square mile.
When we look at the quantity of lightning activity through the lens of density, it becomes clear why Florida is the lightning capital of the United States. With 103 flashes per square mile, it easily has the highest flash density of any state in the U.S. And Texas wasn't even among the top 10 states with the highest lightning density in 2022.
Lightning volume vs. thunderstorm frequency
In addition to the volume and density of lighting activity, we believe it's important to consider the frequency of thunderstorm activity. When we look at thunderstorm frequency, we're measuring the frequency of weather systems that bring lightning to an area. This provides additional context for understanding lightning activity.
Data from our 2022 U.S. Lightning Report illustrates why this additional context is so important.
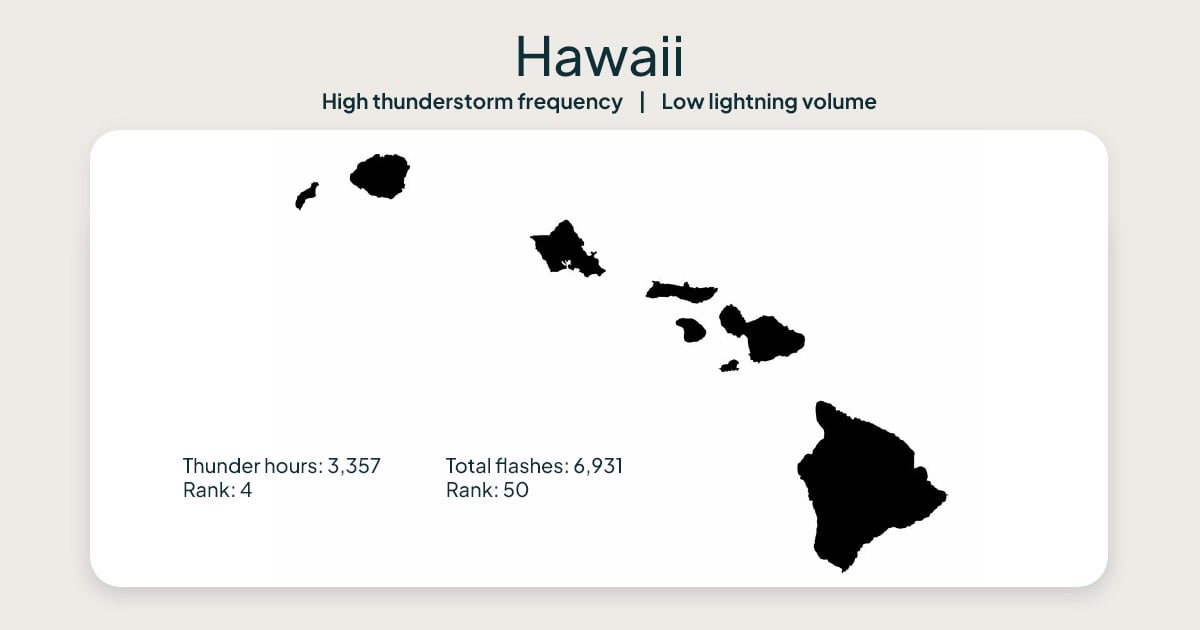
Consider a state like Hawaii. It has the lowest lightning flash count of any state in the U.S. — lower than even Rhode Island. Looking only at volume, it would be easy to dismiss Hawaii as having minimal lightning activity.
But what if we look at the state's Thunder Hours (i.e., the number of hours in the year in which lightning was detected over Hawaii or immediately adjacent to it)? In that case, Hawaii ends up being our fourth highest ranked state — just after Texas, Florida, and Louisiana.
How can a state like Hawaii have so many Thunder Hours while having such a small volume of total lightning flashes? The state's tropical ocean climate results in frequent thunderstorms on and around the island chain. Although these storms often bring lightning, they tend to bring much less lightning activity than the storms we see across much of the continental United States.
While thunderstorm frequency and lightning volume often trend together, there are scenarios — like Hawaii — where they take different directions. If an area has lots of thunderstorms with very few lightning flashes (like Hawaii), then we can conclude those storms, on average, tend to have minimal lightning activity. On the other hand, if an area has a small number of thunderstorms with many lightning flashes, we know the storms in that area tend to exhibit very intense lightning activity. We would completely miss these aspects of the story if we weren't also looking at thunderstorm frequency.
Thunderstorm frequency: Finding the right metric
AEM has selected the Thunder Hour as our preferred metric for thunderstorm frequency because the average thunderstorm lasts for about an hour. Alternative metrics are either too sensitive or not sensitive enough to variations in thunderstorm intensity.
On the one hand, we could simply look at the total number of lightning flashes per year within a given area. The problem is that this metric is much too sensitive. In an otherwise dry area that almost never sees thunderstorms, a single supercell could misleadingly make the area's thunderstorm activity seem comparable to an area that sees many small storms throughout the year.
On the other hand, if we were to look at Thunder Days (the number of days in which a given area experiences lighting activity), we would end up with a metric that isn't sensitive enough. A major supercell that brings hours of lightning activity would count for no more than an average thunderstorm.
The AEM team has written elsewhere about our use of Thunder Hours as a preferred metric for thunderstorm frequency. Here's a blog post we published on the topic. Or you can read our peer-reviewed article in the Bulletin of the American Meteorological Society (BAMS).
Final thoughts: Addressing the elephant in the room
So, there you have it. AEM's U.S. Lightning Report looks at metrics representing the volume, qualities, and density of lightning and the frequency of thunderstorm activity. Each metric tells us about a different dimension or facet of lightning activity. It's like the old parable from India about the blind men and the elephant.
|
The blind men and the elephant
|
Understanding lighting activity is a lot like understanding that elephant. Returning to one of our earlier examples, if we were to try to understand Hawaii's lightning activity only by looking at its volume, we would be exactly like the man who thought he could understand the elephant by touching its trunk.
It's only by looking at these metrics together that we begin to approach a comprehensive picture of lightning activity. If we settle for anything less, we run the risk of having our understanding skewed by the very lens through which we're looking.