In 2022, wildfire cameras captured more than 3 billion images in the U.S. alone, but as wildfires grow in frequency and economic impact, we need to continue to innovate wildfire monitoring, detection, visualization, and coordination tools to protect our communities, infrastructure, and economies while keeping our emergency response professionals as safe and well-informed as possible.
Moving forward, we'll explore why significantly improving wildfire risk management requires…
- Increasing the live viewshed & data gathering capacity
- Building a clear, powerful, digestible data story for fire monitoring and detection
- Transforming that data into real-time decisions when the stakes are highest
...And showcase how SmartGT, our automated guard tour feature, makes all that possible.
Increasing live viewshed & data gathering capacity
Laypeople often underestimate how hard it can be to visualize a wildfire before it grows into a potential threat. That’s because trees, topography, weather, and light can all make it tough to visualize smoke, even using modern wildfire cameras.
Part of addressing that challenge is increasing the number of the right kind of cameras in the field. A network of several cameras with 360° pan/tilt/zoom capabilities can capture a high-risk area from a variety of perspectives, filling in each other’s potential blind spots and creating a more complete story about a potential ignition.
Another key part of the solution is reducing downtime between the field and the command center. The difference between near real-time visualization and a ten-minute downtime between snapshots into the field could easily be the difference between mitigation and catastrophe. We simply need to get data to our land management and fire safety professionals faster.
Building a powerful, digestible data story
With that said, we can’t improve response time during a potential crisis by dumping more data onto a human decision-maker. That’s overwhelming, right?
To illustrate at a very small scale, take a look at the pictures below captured near the Coconino National Forest this summer and ask yourself, “How many do I see smoke in? Where should I be looking in the other pictures to confirm my suspicions about something I see in one of them? What if I was looking at a refreshed array of pictures like this every thirty seconds?”
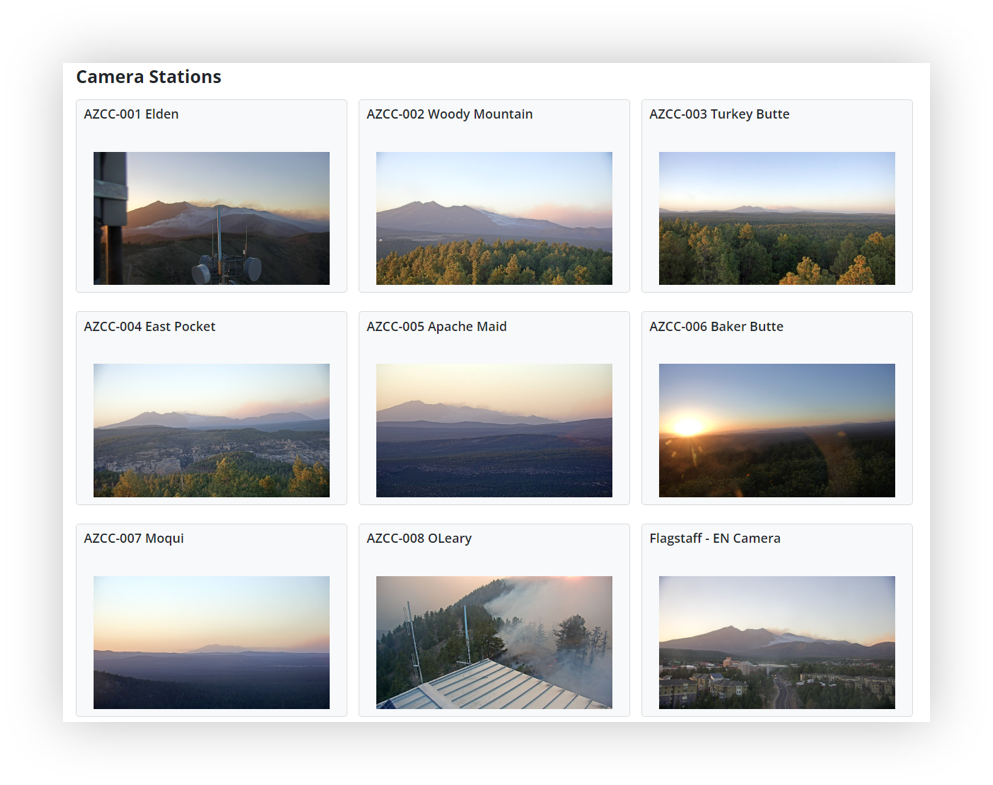
This live array of wildfire camera images illustrates the very real challenges a human forestry or fire service professional might face in the early stages of wildfire detection. They have images from the field and weather station data, but they need to be able to process those pieces of data in a way that makes sense to their human brain.
Approximately half of our brain is devoted to visual processing – we’re built to notice things that aren’t right. On the other hand, data from the field tells us that wildfire detection rates drop as the number of screens being monitored increases. In other words, some of our current leading solutions are actually burning out the best tool in the wildfire monitoring and detection kit: the user’s mind.
Moving forward, digestibility will be key. We can’t just throw forestry and fire service professionals into the deep end of the data pool with no support, which – let’s face it – is what real-time data from a network of dozens of stations and cameras can potentially turn into. We need to shift solution development toward using advances in AI to make the most of the human user’s time by picking and pulling the most relevant information and presenting it in a way that provides a clear narrative about why something is anomalous.
Supporting human decision making
So how do we create that highly visual and data rich (but not overwhelming) environment? The first piece is what we call sensor fusion.
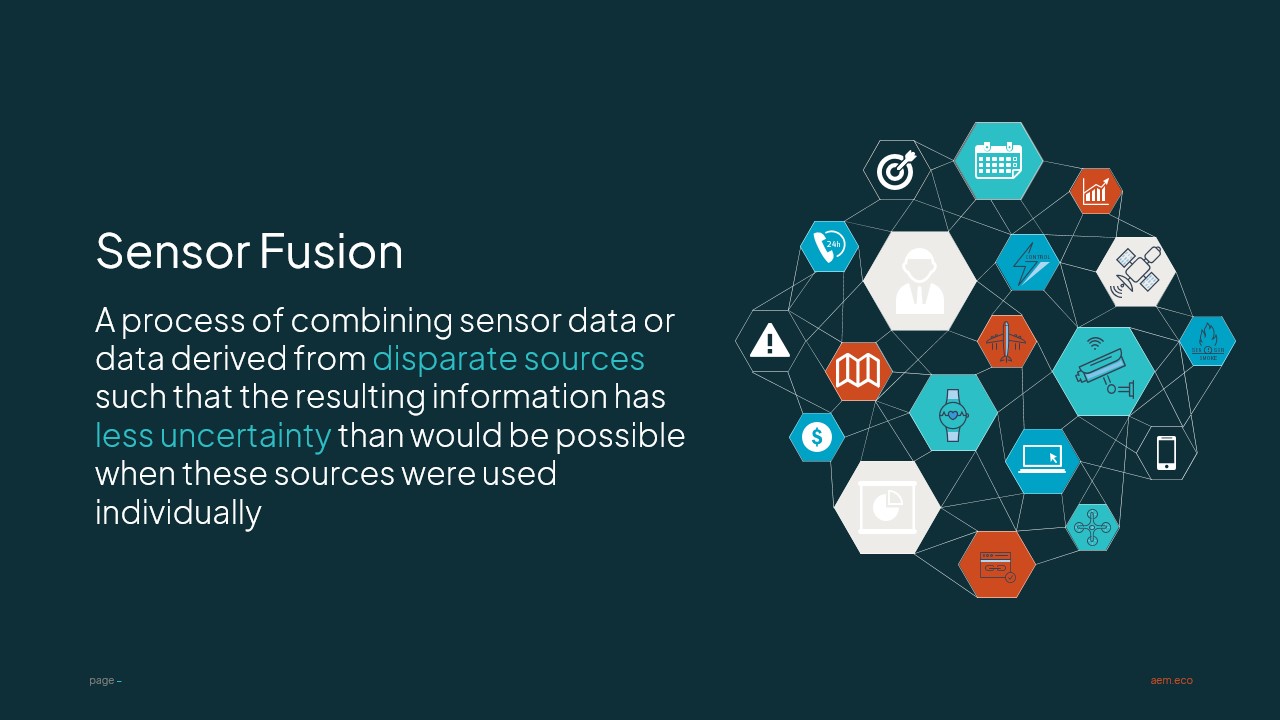
To illustrate, when you put a camera in the field and monitor it from a distance, that’s using one sensor. When you have a lightning detection system that alerts you to strikes and tells you where to point the camera, that’s a multi-sensor system that’s delivering a lot more value than either piece independently.
If you had access to regional forecasting data (generated by stations and sensors in the field) and a study of wildfire risk profiles across your area that told you the areas you needed to be especially worried about (which would’ve been generated using long-term studies carried out using weather sensors), you’d have a sensor network that was telling a predictive – not just a reactive – story about where, when, and how to allocate wildfire assessment and mitigation assets.
With sensor fusion on our side, the next generation of wildfire monitoring technology really comes down to user interface and user experience. How do we bring that data story to monitoring professionals in a way that makes their job easy and sets them up for effective collaboration with their colleagues in the field?
Presenting SmartGT
SmartGT elevates visibility of high-risk wildfire locations in a visual command center that’s empowering, not overwhelming. Development was driven specifically by user feedback and the growing need to monitor more acreage than ever for wildfires with minimal human resources.
.jpg?width=756&height=187&name=Banner_1%20(3).jpg)
Along with several other wildfire detection and monitoring improvements that we’ll be continuing to roll out in the coming months, SmartGT stands apart from other solutions by enabling fully automated 360° guard tours, with images sorted by azimuth to turn camera data into the most digestible and clear story possible.
Thanks to our sister brands at AEM, we’ve been able to add the power of the Earth Networks Total Lightning Network (ENTLN) to our software and increase overall forecasting capacity, allowing users to anticipate and pinpoint lightning risk within the viewshed of their cameras. These locations can be fed into the guard tour to automatically generate a snapshot flipbook, bringing images of the site of a recent lightning strike directly in front of a human reviewer for rapid assessment.
As we continue to develop comprehensive wildfire monitoring and detection tools, we are continually inspired by the work that our colleagues in forestry, conservation, and land management do to ensure that our wildlands are well-protected and well-preserved. If we can make their work easier and their efforts more effective, then we might just stand a chance against this tide of growing wildfires.