Between the final weeks of December and mid-January, California was hammered by relentless rain. Almost all of the state saw 400%-600% more precipitation than usual – with some places getting as much as three feet of rain since Christmas 2022.
Storms of this power, volume, and length are rare but not unheard of, and there’s reason to believe events like these could become more frequent as weather and climate challenges continue to grow. Understanding and analyzing what’s been happening in California this January will be key to protecting coastal communities from the next megastorm.
Moving forward, we’ll explore…
- The causes of the recent flooding in California
- The scale and impact of the floods
- How communities can prepare for the next round of major storms
What caused the January 2023 floods in Northern California?
According to researchers at the United States Geological Survey (USGS), this kind of a extended megastorm forms about once every 250 years in California. The last storm/mass flooding event in the cycle occurred in 1861-1862, suggesting cycles may be getting closer together (although it’s only one data point).
This specific mass flood disaster scenario was actually identified and predicted by the USGS back in 2018 as the “ARkStorm Scenario.” “AR” is short for “Atmospheric Rivers,” and “k” refers to the prefix “kilo” for 1,000, so the name translates to “Atmospheric River Storm x 1000” or “Mega Atmospheric River Storm.” (There’s a joke somewhere in there about building an “ARk,” but we’ll leave that one alone.)
What is an atmospheric river?
According to the National Oceanic and Atmospheric Administration (NOAA), atmospheric rivers are narrow columns of condensed water vapor that travel like rivers from west to east across the Pacific Ocean. A strong atmospheric river can contain 7.5 to 15 times the amount water as the average flow at the mouth of the Mississippi River, so we’re talking about a massive volume of potential precipitation in the atmosphere.
When that “river” of warm water vapor reaches California, it passes first over the California Coast Ranges, across the state, and then over the Sierra Nevada Mountains. As the vapor passes over those mountains, it cools rapidly, turning into precipitation. This usually takes the form of heavy rain along the California coast and Central Valley and significant snowfall in the Sierras and greater Reno-Tahoe area.
The size, volume, and impact of this year’s atmospheric river storm was also likely enhanced by the transition from years of La Niña patterns back toward El Niño.
What are El Niño & La Niña?
El Niño and La Niña are alternating cyclical weather patterns in the Pacific. During El Niño years, warmer-than-average waters tend to cause warmer, dryer conditions in the Northwest and increased precipitation in the Southeastern United States. During the La Niña cycles, waters off the California coast are cooler than average, leading to dry air blowing across the U.S. from west-to-east, reducing rainfall for most of the continental U.S. while leaving the door open for major storms in the Pacific Northwest.
We’ve currently been in La Niña patterns since the summer of 2020, the most prolonged such stretch since 1998-2000. With that said, USGS and NOAA scientists believe we may currently be transitioning back toward El Niño right now as these storms play out.
Atmospheric rivers behave differently based on El Niño/La Niña conditions, so it’s possible that a rapid transition between weather patterns after an extended La Niña could have created conditions that allowed the ARkStorm to make more dramatic landfall and impact higher-population areas.
Are the California floods and recent droughts connected?
In short, yes. The droughts and flooding share a key underlying cause: an extended La Niña that has been a key factor in the western megadrought, followed by an abrupt shift back toward El Niño. Long-term drought also increases the risk of flooding generally, as dry ground is less able to absorb precipitation, significantly increasing pooling and runoff.
Back on December 1 of last year, 85% of California was classified as being in severe drought. As of press, that number has fallen to 46%. This abrupt transition between drought and flood has actually created a major water management challenge for communities across California, as it’s unclear how much of the recently fallen waters they should attempt to store and retrain.
Understanding the scope and scale of the California floods
What we’ve described above (an atmospheric river pumped up by a shift back towards El Niño) can easily create a powerful, flooding storm. Now take into consideration that nine different atmospheric river storms have hit California in the past three weeks, dumping an estimated 24.5 trillion gallons of water on the state and its residents.
According to KCBS Radio News, the city of San Francisco alone has received over 8 inches of rain so far in 2023, with more than half of that coming in the last week. Across the state, communities have seen four to six times as much precipitation as would be normal for this time of year. The Sierra snowpack in the mountains was at 247% its average on Monday, January 16. The Sacramento San-Joaquin River Delta had an average flow rate of 1.19 million gallons per second on Friday, January 13.
Rainfall totals for the last 30 days for locations across Santa Cruz County as of January 23, 2023. |
Those measurements are statistically impressive, but they do nothing to quantify the dramatic human toll of these megastorms. At publication, there have been at least 20 confirmed fatalities related to these storms across the state since Christmas 2022. More than 200,000 homes and businesses have been without power at some point this year.
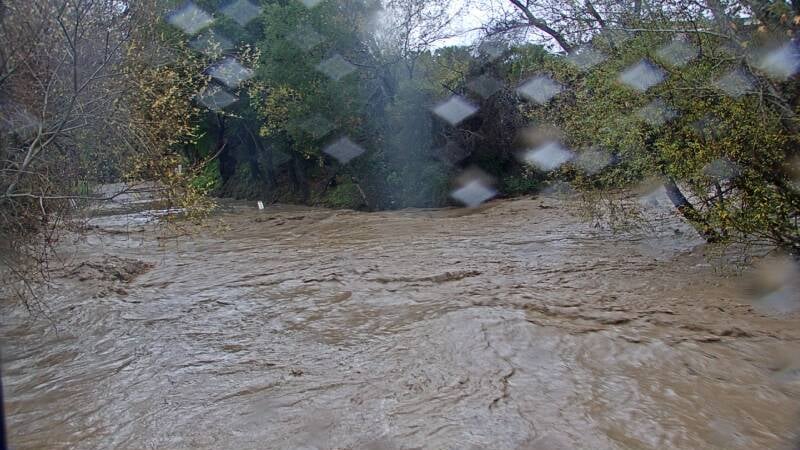
Refugio Road in Santa Barabra County, captured on January 9, 2023. |
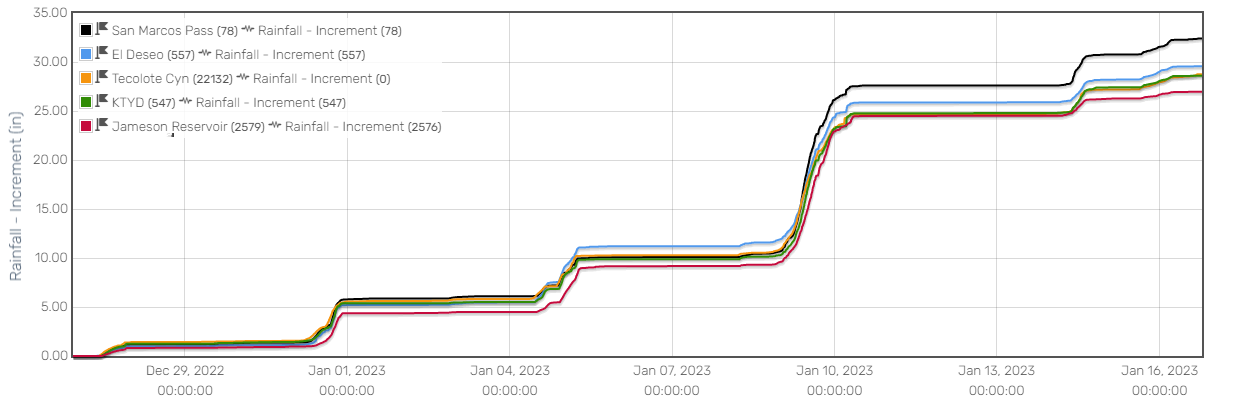
Rising rainfall totals for a variety of locations in Santa Barabra County between late December and mid-January |
High water, mudslides, and beyond have closed and damaged roads of all sizes across California, including slowing the flow of Interstate 5, the state’s major trucking route. Near Santa Barbara, the flooding opened sinkholes that swallowed several cars and damaged dozens of homes. Many farmers across the state are dealing with significant crop loss due to flooding. All told, the storms have already caused an estimated thirty-four billion dollars’ worth of damage, and that doesn’t account for the psychological and emotional impact this disaster has had on the public and emergency response professionals.
How can technology help communities prepare, respond, and recover?
As we mentioned above, U.S. government agencies like the USGS and NOAA predicted that this kind of megastorm scenario was possible, even likely, for California. Unfortunately, however, those warnings didn’t translate into preparatory action at the local level. As severe weather events become more common, closing that gap in proactivity will be essential to minimizing the impact that inevitable floods, lightning, wildfires, and so on can have on a community.
A big part of the answer is getting weather data, forecasting, and alerting technologies directly in the hands of local municipal and public safety leaders, not waiting for it to trickle down from federal or state agencies. When those on the frontlines can build an understanding of the weather that’s tailored to their location and public safety priorities, not generalized to an entire region, it’s much easier to understand what the information means and how to respond.

At the same time, when local leaders take ownership of weather intelligence, there’s a higher degree of information and accountability at ground level. That leads to better decisions for the community and the ability to deliver the best possible local response rather than waiting on support from outside agencies who might not understand the local culture, values, and priorities.
Let’s take a moment to dive into some specific tools and technologies that cities and counties can adopt to increase their overall readiness and build resiliency in the face of growing climate challenges:
Forecasting
Knowing when potentially severe weather is incoming and where it’s likely to be most destructive are key to preparing effectively and allocating assets where they’ll be needed most. Big public agencies simply don’t have the time or capacity to create personalized forecasts for each community that could be impacted by a major weather event. That’s why cities and counties across the country are increasingly turning to private forecasting services to close the gap.

With a meteorological services partner at their side, municipalities can gain access to custom forecasts and weather dashboards that keep local leaders, public safety professionals, and emergency responders aware of key current and upcoming conditions. That data empowers local communities to coordinate their own preparation for and response to severe weather events rather than relying on intelligence from larger agencies and guesswork.
Modeling & preparation
With access to historical weather data and professional meteorologists, community and emergency management leaders can also build a proactive understanding of what a major weather event in their community is likely to look like for preparation and training purposes.
By using weather data for modeling, local leaders can decrease their reliance on state and federal agencies to coordinate a response to a major flood event in their area. Instead, they can build a proactive response plan that helps each team and stakeholder understand what the next big storm could look like and their role in helping protect the community.
Monitoring & alerting
Forecasting services can help municipal leaders understand the big picture of a severe weather event, but local environmental monitoring sensors are crucial to getting a real-time look at exactly how weather is challenging the community.
For example, water level monitoring sensors around dams and reservoirs can help water management professionals understand weather to retain stormwaters or allow them to flow. Road weather sensors can tell public works and transit crews when conditions in a given location are becoming unsafe due to ice, floodwaters, and beyond.

The best part of environmental monitoring is that, when paired with custom alerts, it’s a largely passive process. That means the sensors are constantly gathering data, but they don’t need to be monitored by a human professional around-the-clock. Instead, they can be configured to send a notification to the appropriate people when a certain threshold or limit is reached, telling them exactly when it’s time to take action.
Response coordination
As the California ARkStorm and mass flooding illustrate, the challenges of responding to severe weather events are bigger than any single community. For that reason, it’s essential for local leaders to be able to share their weather and sensor data with both larger weather and emergency response agencies.
By creating a weather and environmental monitoring dashboard, municipal leaders can create an ideal framework for clear, meaningful data sharing and collaboration. With that two-way dataflow with larger agencies, local leaders can improve the quality of the response their community receives and offer timely, targeted support to citizens and businesses in the areas of greatest need.
Talk to a severe weather and public safety expert
If you’re in public safety, emergency management, or municipal leadership at the state, county, or city level and you’re looking to improve your approach to severe weather, flood, or wildfire risk management, AEM is here to help. Our purpose is to empower communities and organizations to survive – and thrive – in the face of escalating environmental risks.

Our team of emergency management solution experts specializes in helping leaders align weather services and technologies to their specific needs, goals, and budget. If you want to learn more about what you can do to improve overall weather resiliency in your community, contact us today!