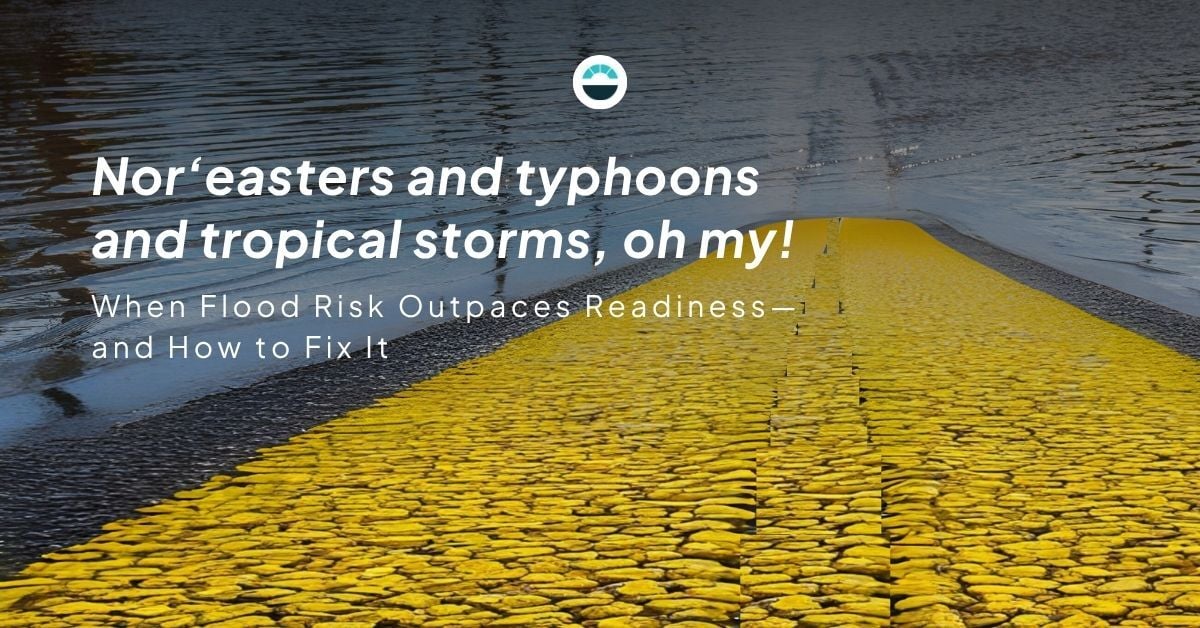
“Lions and tigers and bears, oh my!” Unlike Dorothy’s list of imagined dangers in The Wizard of Oz, the list of flood hazards is very real—and much longer. Whether from snowmelt, pop-up storms, nor’easters, atmospheric rivers, tropical storms, or typhoons, flood risk is impacting more people, in more places, more often. We’ll examine how this growing, year-round risk is outpacing readiness in many communities—and how to close the gap.
- We'll look at how flooding extends beyond spring and early summer to create a year-round problem.
- We'll zero in on the autumn flood season to see how the underlying mechanisms extend across seasons and regions.
- From there, we'll shift gears to look at why the impacts of these storms keep rising.
- And, we'll examine the barriers that get in the way of flood readiness keeping pace with growing flood risk.
- Finally, we'll look at how to remove those barriers.
Flooding: A year-round hazard
Most people think of flooding as a spring or early-summer problem, tied to snowmelt and seasonal pop-up storms. In reality, it is a year-round hazard.
As autumn settles in, the United States has been experiencing flooding from coast to coast: a nor’easter along the Atlantic seaboard; tropical storm remnants in the Colorado Rockies; an atmospheric river in Southern California; and Typhoon Halong’s remnants in western Alaska. This convergence of different types of storm systems—each powerful in its own right—makes fall a season when flood risks are especially widespread in the U.S.
To see why this is a year-round problem, let’s examine the storm types now in season—and how they jointly expand the geographic and seasonal reach of flood risk.
A seasonal convergence of hazards
As fall takes hold, a distinct set of storm systems comes into season across the U.S. Although they involve different engines, they result in one consequence: flooding.
-
Nor’easters (September-April)
Along the Atlantic seaboard, nor’easters take the stage as summer fades. They can form any time of year, but they are most frequent and most violent from September through April, stacking wind, surge, and heavy rain on already elevated tides.
-
Atlantic tropical storm season (June-November)
To the south and east, the Atlantic tropical storm season runs June through November. Late-season tropical storms (or their remnants) can push exceptionally high atmospheric moisture deep into the interior. It is not uncommon for remnants to push moisture deep into midwestern states like Illinois and Missouri—occasionally as far as the Colorado Rockies. Banked against the Rockies and lifted upslope, that moisture wrings out as excessive rainfall, driving rapid river rises and flash flooding.
-
Atmospheric rivers (October-April)
On the Pacific side, atmospheric rivers (ARs) dominate the cool season from October through April along much of the coast. These long, narrow plumes supply a striking share of West Coast precipitation—about 30–50% in just a handful of events—and, when plumes stall against terrain, they drive many of the region’s most consequential floods.
-
Pacific typhoons (June-October)
Farther north, Alaska’s autumn flood risk often comes from powerful extratropical storms spun up by the remnants of West Pacific typhoons crossing into the Bering Sea—systems capable of hurricane-force winds, heavy surf, and damaging coastal inundation for low-lying western communities.
Different regions; different mechanics; same outcome. That’s why fall flood risk is especially widespread.
Why flood risk is rising
We’ve seen how different storm types converge to produce widespread flood risk. The bigger question is why the impacts of these storms keep growing.
-
More intense rainfall
As temperatures rise, the air can hold more moisture. When storms form, there’s simply more water available to fall as rain. We’re seeing it in several ways: tropical systems producing heavier rain, atmospheric rivers lasting longer and covering more ground, and more frequent high-end rain days across many basins. The tilt is toward heavier downpours.
-
Increased coastal vulnerability
Along the Atlantic and in western Alaska, water levels are higher than they used to be. On the East Coast, rising seas plus sinking land boost high-tide flooding and leave less room before nor’easters and other storms push water ashore. In Alaska, rising seas and less autumn sea ice remove a natural buffer, so strong Bering Sea storms—often energized by typhoon remnants—can drive bigger waves and deeper coastal flooding. In both places, a higher baseline turns the same storm into a bigger flood.
-
More runoff from the built environment
Urbanization adds impervious surfaces—roads, parking lots, rooftops—that block infiltration and speed water into streets and channels. Encroachment into floodplains, channel straightening, and aging stormwater systems further reduce storage and slowdowns. The result: faster rises and higher peaks, even when rainfall totals aren’t record-breaking.
Why flood risk outpaces readiness
Despite the shift toward heavier downpours and increased coastal vulnerability, many jurisdictions still rely on fragmented information flows, ad-hoc judgment, and tools built for yesterday’s hazards.
-
Fragmented situational awareness
Observations, forecasts, and field reports live in different systems and arrive on different cadences, so decision-makers reconcile dashboards by hand while water is rising. -
Unclear trigger points
Too often, actions hinge on ad-hoc judgments instead of pre-set triggers tied to stage, rate-of-rise, tide anomalies, or forecast cues. -
Outdated or non-operational maps
Inundation products exist but aren’t built for operations—no depths, velocities, or arrival windows—or they’re scattered as static PDFs that can’t support real-time action. -
Fragmented public messaging
Multiple departments publish on different timelines and channels with inconsistent language, leaving residents and visitors unsure when and where to move.
-
Instrumentation gaps and single points of failure
Sparse rain/stream coverage near decision locations, limited backup power/telemetry, and a lack of automated health checks can create blind spots at the worst moments. -
After-action learning that doesn’t stick
High-water marks, closure times, resource conflicts, and comms metrics are captured unevenly, so models, thresholds, and playbooks don’t improve from one season to the next.
Fragmented awareness and messaging, unclear triggers, and non-operational maps (along with the other gaps we’ve highlighted) interrupt the conversion of observations into coordinated actions. The result is slower, less consistent responses, and floods that cause more harm than they otherwise would.
Strategies to close the flood readiness gap
To close the gap between risk and readiness, we need to strengthen the connection between observation and action.
-
Establish a shared operating view
Establish a common, role-aware view where observations, forecasts, and field reports update on compatible cadences. The aim is a single operating context to reduce tab-hopping, reconcile conflicts, and shorten time from signal to decision. -
Define clear, rule-based triggers
Replace ad-hoc judgment with pre-agreed, measurable rules that combine signals (e.g., rainfall rate + river stage + rate-of-rise + tide anomalies). Tie each rule to specific actions—closures, detours, pump starts, EOC posture—and keep the matrices current through exercises and post-event updates. -
Make flood maps actionable, not decorative
Move beyond reference layers to street-level inundation intelligence: depths, velocities, and arrival windows linked directly to routes, closures, facility protection, and resource staging. Keep these layers live in the same operating view used for decisions and public comms.
-
Coordinate execution and messaging
Align public updates with internal decisions, leveraging shared thresholds, cadence, and language. Define common update intervals. Use pre-approved templates and a single authoritative source for status and maps. -
Make sensing and comms resilient
Treat telemetry like critical infrastructure: dual-path comms where needed, backup power, device-health monitoring, and coverage at decision points (e.g., culverts, control structures, tide-sensitive low spots, chokepoints).
-
Make learning automatic
After each event, capture high-water marks, peak timing, closure/open times, resource conflicts, and comms performance. Feed that data back into thresholds, maps, and playbooks, so the measurement-decision chain continues to get tighter.
Conclusion: From observation to action
Flooding isn’t a season; it’s a systems test. When the links from observation to action are tight, operations stay consistent, yielding clearer decisions, faster moves, and smaller losses. If any of those links aren’t defined and operable, that’s your gap. AEM can help close it with a shared operating view, operational inundation mapping, rules-based triggers, and resilient sensing.
Schedule a 30-minute working session, and we’ll show you how to bridge the gaps between observation and action.