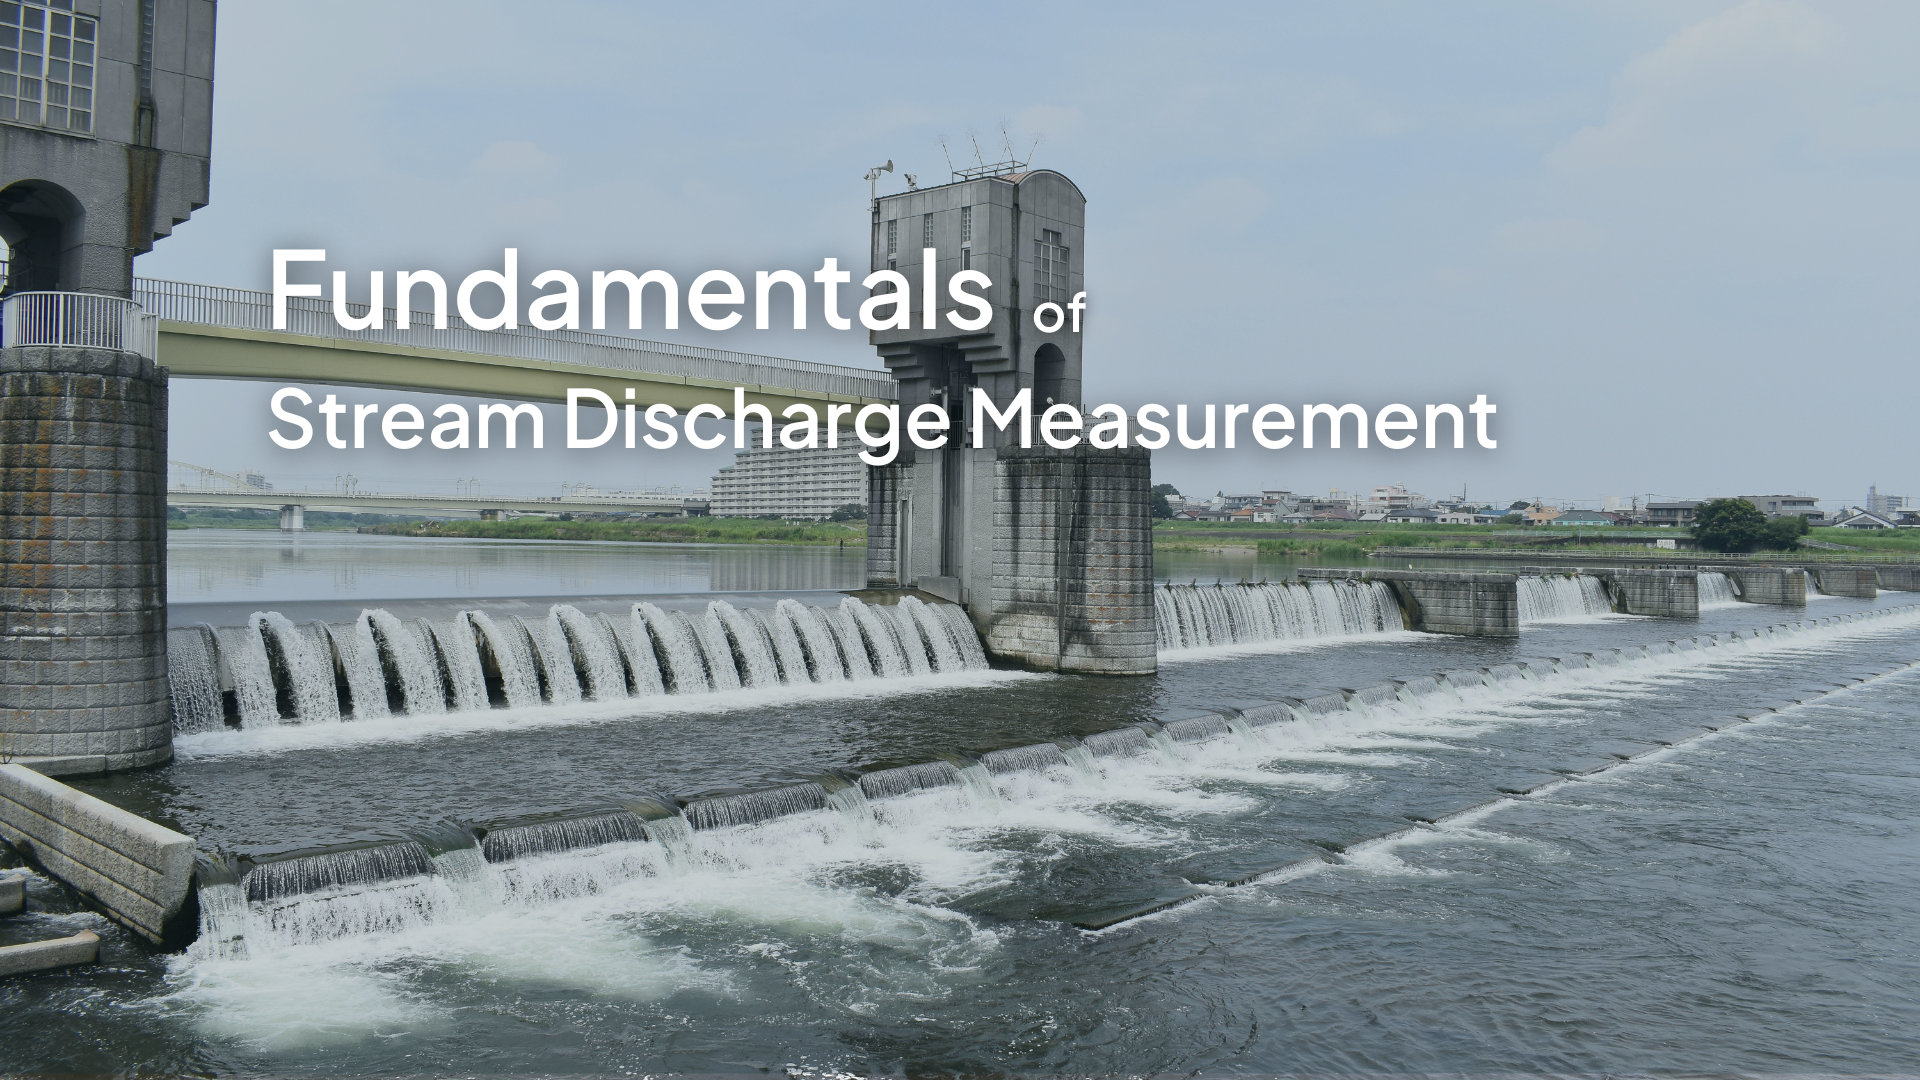
As water flows through our planet’s waterways, it profoundly impacts both natural and human habitats. Its flow brings energy, irrigation, and potable water to countless people, but it can also bring flooding and pollution. Monitoring this flow is crucial for flood control, water quality management, and conservation. But how do we measure it accurately?
In this guide, we explore the basics of water flow or discharge measurement:
- We define water discharge and its significance.
- We address the challenges involved in measuring water discharge in open channels like streams, rivers, and ditches.
- We discuss tools and techniques for overcoming these challenges.
Whether you're an experienced hydrologist or new to water management, this post will enhance your understanding of water flow measurement.
Stream discharge: What it is and why it matters
Water discharge, also known as flow or discharge rate, is the volume of water passing through a specific point over a fixed period. In open channels like streams, rivers, and ditches, it may also be called surface flow or stream discharge. It's typically measured in cubic meters per second (m³/s) or cubic feet per second (cfs). Monitoring stream discharge is critical for flood management, water quality management, and water conservation.
- Flood management
Accurate stream discharge measurements supplement stage measurements to predict and manage floods. High water flows or discharge rates can signal impending flood events, providing time for evacuation and securing property. Understanding river dynamics helps in designing effective flood mitigation infrastructures, such as dams, levees, pumps, and open flood plains.
- Water quality management
Stream discharge affects the dilution and dispersion of pollutants. High flows disperse pollutants, reducing their concentration, while low flows may cause pollutant accumulation or impact water temperatures. Monitoring water flow helps us protect habitats, predict the spread of pollutants, and manage sediment build-up.
- Water conservation
Stream discharge measurements can be used to estimate the annual quantity of water produced by a watershed (i.e., its water yield), informing decisions about reservoir filling, the use of hydroelectric power, and conservation for lower-flow seasons.
How to calculate water discharge
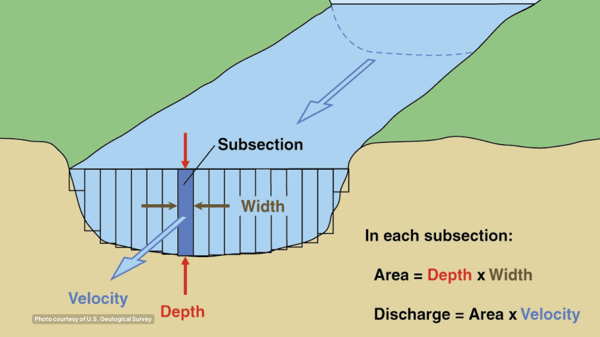
Water flow is typically represented through the equation, Q=A*V, where:
- Q is the discharge (flow)
- A is the area of the cross-section through which the water is flowing
- V is the velocity of the water
So, if you know the velocity of the water through a cross-section of a channel, and know the area of that cross-section, you can calculate the flow or discharge for that specific cross-section.
Essentially, measuring water flow is much like counting the number of cars passing a particular point on a highway in an hour; water velocity is like the speed at which each car is driving.
The concept of water flow may be simple, but irregularities in the shape and depth of channel cross-sections can complicate the process of determining real-life stream discharge rates. There are two main methods for dealing with these irregularities: the primary device method and the conventional current-meter method.
Primary device method
One approach is to eliminate the need to take measurements across channel irregularities by forcing the water to flow through or over a known, uniform opening. The primary device method does just that. The main types of primary devices are flumes and weirs.
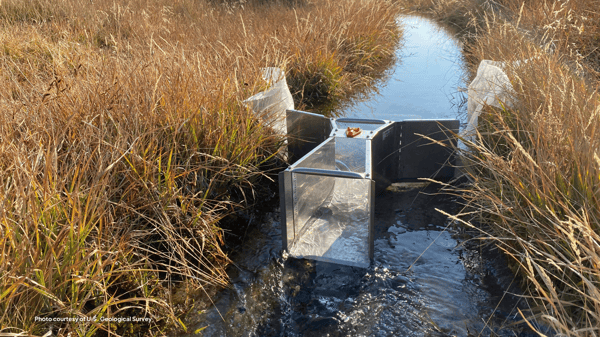
Flumes
A flume is a fabricated channel that acts like a chokepoint in the natural channel. Unlike the natural channel that flows into it, the exact dimensions and shape of the flume are known precisely. By measuring how much water rises before the chokepoint, hydrologists can calculate the incoming flow.
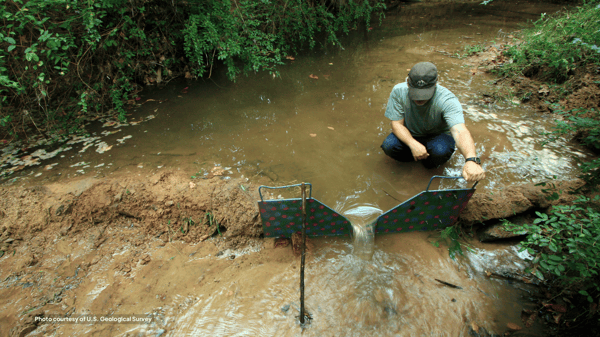
Weirs
A weir is like a low-level dam (i.e., a weir plate) that allows water to flow over its top through a specially shaped opening – usually a V-shaped or rectangular notch. The weir causes upstream water to pool. By measuring how much water rises at the crest of the upstream pool, hydrologists can calculate the incoming flow.
Pros and cons of primary devices
When installed correctly and used in the right applications, both weirs and flumes can provide highly accurate discharge readings. However, their installation modifies the channel and can therefore impact wildlife and ecosystems. This is especially true of weirs and the upstream pooling they cause.
These devices can be expensive and complex to install. Flumes require more material and more complex fabrication than weir plates, but weirs require meticulous preparation of the upstream pool and regular maintenance due to sediment and debris buildup that can degrade accuracy.
Conventional current-meter method
A different way to deal with the complexity of channel irregularities is to break measurements down into smaller, more manageable units. This is the essence of the conventional current-meter method.
- Segmenting the cross-sectional area
Natural channels like streams and rivers have varying depths. To calculate the area of a channel cross-section accurately, the observer takes multiple depth readings at regular intervals across the channel. This yields a series of smaller subsections or water columns where the length, width, and depth/height of each column is known.
The EPA’s National Nonpoint Source Monitoring Program recommends dividing stream cross-sections wider than 10 feet into 20-25 subsections, where each subsegment represents no more than 10% of the total streamflow.
- Segmenting water velocity measurements
Just as the area of a cross-section is impacted by variations in the depth of a channel, so is water velocity. Variations in the texture and gradient of the streambed may also impact velocity. Therefore, it is generally a best practice to use a current meter to take separate velocity measurements for each column of water within the cross-section.
Water velocity can also vary across different depths within the same water column. To get the average velocity of a water column, it is recommended that velocity measurements be taken at several different depths within the column. After the measurements have been taken, there are several methods for calculating the vertical mean velocity of the water column.
- Calculating cross-sectional discharge
Once we know the area of each water column and the velocity of water through each column, we can calculate the flow or discharge of each water column. After we know the average discharge for all the water columns, we can bring them together to get the average flow or discharge of the overall cross-section. But the equation is more complex than the simple three-value equation that we started with. It is:
Q=(Q1+Q2+Q3…)/ W, where:
- Q is the overall flow rate of the cross-section
- Q1, Q2, Q3, etc. represent the flow rates of each water column in the cross-section
- W is the total number of water columns in the cross-section
Types of current meters
The accuracy of the current-meter method depends on the precision of its depth and velocity measurements. We already have a blog posting on measuring water depth. However, it may be helpful to say something here about the various options for measuring water velocity.
Float meters
Floats are simple, straightforward tools. They’re placed in the water, released, and allowed to float downstream for a pre-determined distance. The distance covered (in feet or meters) is divided by the time it took (usually in seconds) to reach the predetermined distance.
Unfortunately, float meters are among the least accurate water velocity meters. And since they can only measure surface velocity, they require a coefficient or correction factor to derive the average velocity of the water column. Selecting the right coefficient factor requires knowledge of the stream bed conditions.
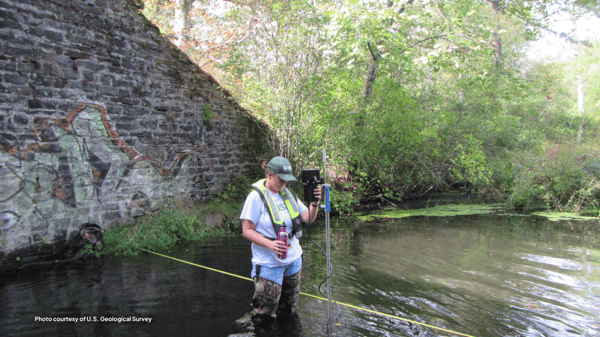
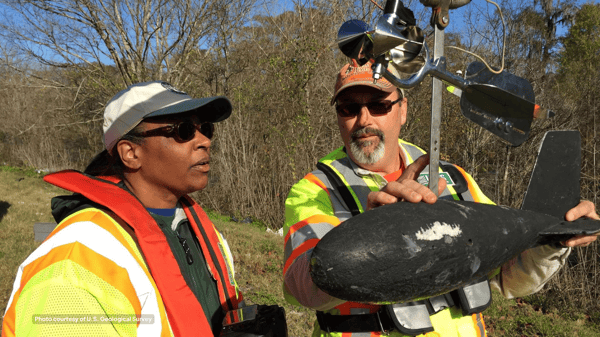
Propeller & Electromagnetic Meters
Current meters, such as propeller or electromagnetic types, offer more accurate measurements. Whether lowered into the water from a bridge or boat or via a staff gauge, the spinning of the propeller or changes in electromagnetic fields provide a measure of the water's speed. However, they can be labor-intensive to use.
Acoustic Doppler Current Profilers (ADCP)
Acoustic Doppler Current Profilers use the Doppler effect to measure velocity. The underlying idea is that sound waves change in frequency due to motion, like how a siren's pitch changes as an ambulance passes by.
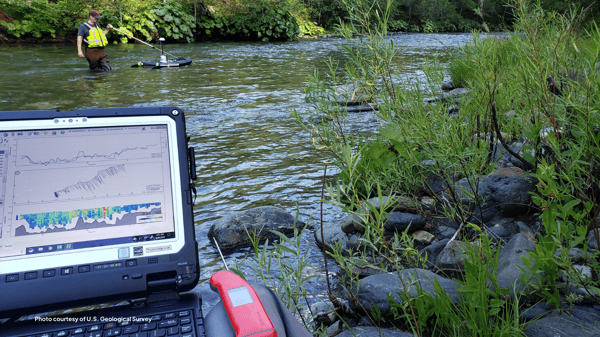
ADCPs measure velocities at multiple depths simultaneously, providing a detailed picture of the entire water column. They're non-intrusive, meaning they don't disturb the water body or its flow. They can also be deployed in various ways - mounted on a boat, deployed from the side of a river, or moored in place (such as to a bridge) for long-term monitoring.
But, ADCPs also require skill to operate and interpret, and they can be quite expensive. Lastly, factors like water temperature, salinity, and the presence of air bubbles can affect performance.
Surface Velocity Radar
Radar sensors rely on the same principle as other radar devices. They transmit electromagnetic waves and measure the time it takes for an echo of that signal to return to them. When radar is calibrated correctly, those echoes can be used to decipher a significant amount of information, including the velocity of the water surface below. To provide accurate readings, the radar should be mounted level, on a stable structure, with an unobstructed view of the water below.
While surface velocity radar has a limitation over some other types of velocity meters (i.e., it cannot detect water velocity below the surface), it also has some critical advantages. First, it can operate without coming in direct contact with the water, which means there is less opportunity for expensive equipment to become damaged during use. When integrated with data logger technology, it enables readings to be collected remotely.
Continuous discharge monitoring
For most applications, an individual point-in-time measurement of stream discharge is of little value. For example, to understand how a water system might be dispersing pollutants or the annual water yield of a system, hydrologists need to monitor its discharge continuously over time.
Unfortunately, the process of gathering velocity and depth measurements throughout multiple channel cross-sections can be quite labor-intensive. This can make it impractical to utilize the conventional current-meter method for continuous discharge monitoring. Fortunately, there’s a solution.
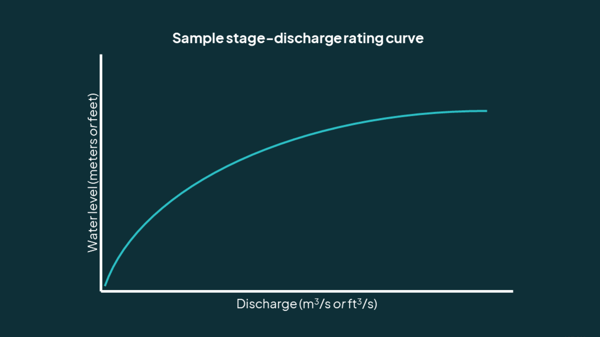
The stage-discharge rating curve
As it turns out, there is a non-linear relationship between a site’s current stage or water level, on the one hand, and its discharge, on the other hand. That relationship is represented as a stage-discharge rating curve. Once hydrologists know that relationship, determining the current discharge for a site can be as fast and simple as observing its stage.
However, the process of developing the stage-discharge rating curve does require some considerable time and effort. Hydrologists need to collect a large number of labor-intensive discharge observations over time when the water at each site is at different levels. As they correlate more discharge observations with stage observations, the stage-discharge rating curve begins to emerge.
A limitation of stage-discharge rating curves
Unfortunately, for all the time and effort that goes into developing stage-discharge rating curves, their useful lifespan is remarkably unpredictable. Rivers and streams constantly deposit silt, sediment, and other debris in new locations. Over time, this changes the shape and texture of the channel. In some cases, such as during a flash flood, those changes can occur abruptly. As a result, stage-discharge rating curves that were reliable yesterday may suddenly become unreliable today.
Without an independent method of determining discharge, there is no way to know immediately whether the reliability of a stage-discharge curve has been compromised. To ensure the ongoing reliability of a curve, hydrologists would need to continue collecting the same labor-intensive velocity and depth observations to validate the curve against new discharge calculations. Luckily, there’s a more efficient way to validate stage-discharge curves.
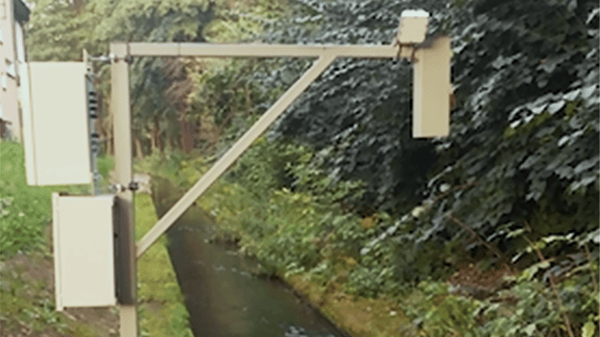
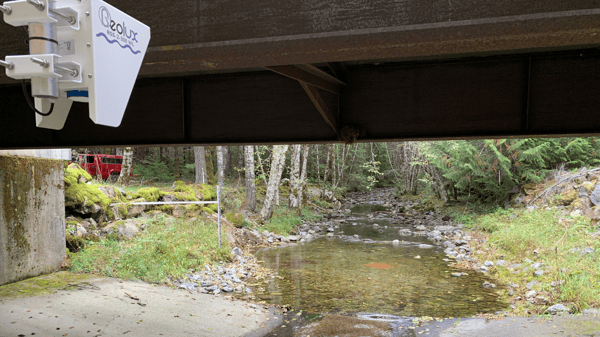
Radar flow meters
A radar flow meter takes continuous discharge observation a step further by providing contactless measurements of both surface velocity and water level. The unit then draws on its velocity measurements, water level measurements, and configured data about the cross-section of the channel to automatically calculate discharge. When combined with a data logger and telemetry, a radar flow meter can virtually eliminate the labor involved in monitoring stream discharge at a site.
What’s more, because radar flow meters independently calculate discharge, they can corroborate readings gathered from stage-discharge curves. When calibrated correctly, discharge readings from a radar flow meter should generally align with readings from a stage-discharge curve. If there is a sudden discrepancy between the two readings, or if the two readings begin to drift apart over time, this could indicate that something about the shape or texture of the stream bed has changed enough to impact the reliability of the stage-discharge rating curve.
Design your perfect water monitoring solution
Looking for some extra help to develop or expand your water monitoring network? AEM's Hydrologic Network Design Services can help you design and build a network that is ideally suited to your unique needs. Contact us for a free consultation.